Why is it relevant?
A common concern about Citizen Observatories is uncertainty regarding the quality of the collected observations. Many organisations and researchers have been asking: Can citizens provide data that are of the same quality as professional scientists? Learning and implementing best practices on how to define and expose the data quality information will lead to reliable and trustworthy data sets and will minimise uncertainties regarding the collected data.
How can this be done?
Ensuring data quality should be done according to the specific scientific discipline(s) that your Citizen Observatory needs to draw on. This varies depending on which environmental issue you are focusing on. It requires the involvement of one or more trained scientists from those fields; they can help you design the appropriate scientific methodology that ensures your data will be fit for purpose (more on how to engage key stakeholders here).
There are several key elements to ensuring data quality. Apart from the obvious, namely positional (locational) accuracy, other aspects to consider are completeness, consistency, thematic accuracy and temporal homogeneity. The ISO standard ISO 19157 provides a common vocabulary for data quality concepts. It was initially designed for cartography and includes a long list of standardised quality measurements and methodologies. It is also applicable for Citizen Observatories and citizen science.
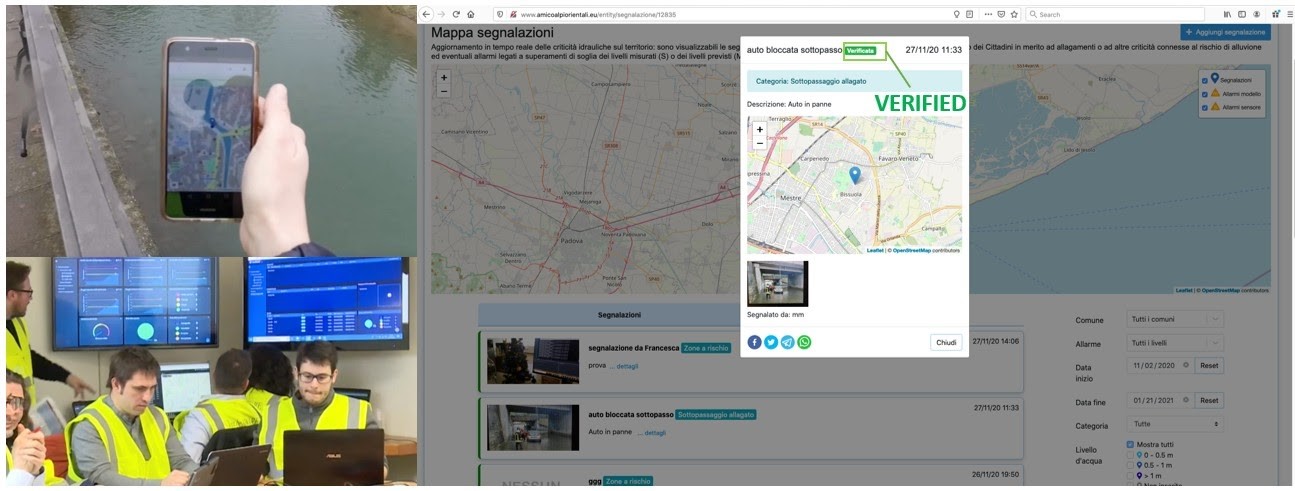
Example from the Citizen Observatory of Water for flood risk management in the Brenta-Bacchiglione catchment (Italy)
In the Brenta-Bacchiglione Citizen Observatory, authorities must be able to manage variable quality of information (e.g. crowdsourced observations regarding the water level of a river), in order to have access to an accurate and consistent data set to be taken into account for decision-making purposes. In the data management platform, automatic filters provided for validation operations are also integrated with ‘manual’ control systems to be used if necessary. Information reported, such as the presence of flooded areas, are published on the platform as “verified by the authorities” only if confirmed by a certain number of reports or by a Civil Protection team sent to the specific location.
Data reliability (or replicability) is about whether you can get the same results when you repeat an experiment or observation. For example, suppose that you see a bird and identify that bird as a robin. At the same time, someone else sees the same bird and comes to the same conclusion. The data is reliable because multiple observations have given the same result.
The participation of many observers in your Citizen Observatory with different degrees of expertise can be compensated by taking advantage of expert contributors who can review the observations of others. When citizens use inexpensive or DIY sensors connected to smartphones, there are also concerns about data quality and stability of the measurements. In the sensor.community initiative, citizens are encouraged to regularly collect data close to official stations as a way to estimate the bias and degradation of low-cost sensors and to ensure compatibility with official sources.
A lack of citizen expertise can also be mitigated by providing comprehensive and focused training for new participants in the Citizen Observatory in order to ensure they know how to collect valid observations. This training can be done in the form of face-to-face workshops, online video tutorials or courses, and can be complemented by extensive training materials on the website of the Citizen Observatory.
Data quality at the observation level can also be improved by providing well-designed data collection tools that minimise the chances of data collection errors. For qualitative values, multiple-choice selectors can be provided instead of free text inputs. For quantitative values measured by soil and air temperature sensors, values outside of a predefined range can be considered wrong and eliminated before allowing values into the system storage.
Example from the LandSense project
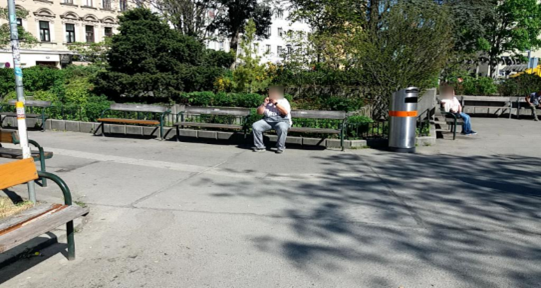
LandSense also uses a quality assurance system to make sure data collected for land cover detection, agricultural monitoring and habitat monitoring campaigns are ‘clean’. First, the system checks for overlaps in areas drawn by users and flags them so that users can correct them. Next, the system looks for problems with photographs. Many citizen science projects have mobile apps that ask citizens to take photographs as part of the data collection process, but this can create issues of personal privacy. For example, faces and license plates are automatically blurred out to comply with the EU General Data Protection Regulation (GDPR). Photographs are also checked to make sure they are not too dark or blurry. Next, the service checks for position accuracy, using mobile phone GPS to make sure an observation is geographically accurate. It also checks against reference data from a ‘gold standard’ data set produced by professional scientists to make sure there is an overall agreement and that nothing is omitted or entered incorrectly. Finally, the service compares answers from the same location given by multiple contributors to provide a level of confidence in the data.
Example of a photograph from the CityOases mobile app with blurring from the LandSense quality assurance service applied to faces
Reliability in Machine Learning
Common examples of non-reliable data are observations provided by uncalibrated sensors (instrument biases) or human misinterpretations, but reliability problems can also emerge in artificial intelligence. In the Scent project, citizens are guided to areas where there is a need for environmental information. In those locations, they collect images of land cover/land use. Images can be submitted to the ScentIntelligence Engine (SIE); a tool that uses machine learning to automatically detect land cover types and objects in an image according to Scent’s taxonomy. The system works by assigning a score to each annotation tag. If the score is high enough, the annotation is considered valid. If not, the image is redirected to Scent Collaborate, where citizen scientists manually annotate the images.

Data validity assesses how credible or trustworthy the data are. The collected data are valid if they accurately represent the real world. For example, suppose you measure air quality using a low-cost sensor, but it has not been correctly calibrated. When such observations are integrated, we can provide a data validity indicator for the data set.
In dynamic data sets that are constantly updated, data quality has to be constantly assessed. It is currently accepted that data quality should be based on the ‘fit-for-purpose’ concept. In addition, Citizen Observatories’ data will be used in combination with other data sources. That is why it is recommended to provide the necessary tools for estimating the components of data quality and to allow comparison with other data sets.
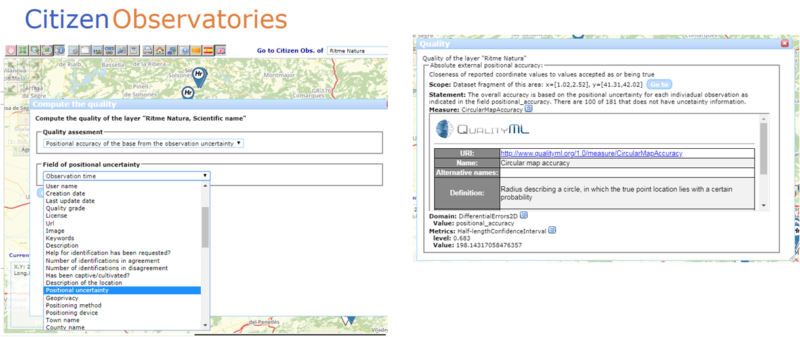
Example from the GroundTruth 2.0 project
In the Ground Truth 2.0 project, we developed a set of quality measures that can be applied directly in the Citizen Observatory data set while being visualised. The result of the quality assessment is presented in a standard form and associated to the QualityML vocabulary.
The quality assessment can be shared with other users of the data set.
Useful Resources
WEBINAR: “Ground Truth Week 2019 – Webinar 3.2 – Data quality and interoperability” describes the capabilities of the quality tool developed in Ground Truth 2.0 and demonstrates how to use it in a real-life scenario.
BOOK CHAPTER: “Chapter 8 Data Quality in Citizen Science” in the book “The Science of Citizen Science” discusses the broad and complex topic of data quality in citizen science and how we can ensure the validity and reliability of data generated by citizen scientists and citizen science projects.
WEBSITE: QualityML is a dictionary based on the ISO19157 that contains hierarchically structured concepts to precisely define and relate quality levels: from quality classes to quality measurements.
You may also be interested in:
I want to work with data…
…by sharing Citizen Observatory data
…by integrating data from several Citizen Observatories/other sources
I want to generate insights results from data and knowledge…
This work by parties of the WeObserve consortium is licensed under a Creative Commons Attribution-ShareAlike 4.0 International License. ![]()