Why is it relevant?
Your Citizen Observatory is fully up and running and you are collecting lots of data. Now you need to translate these data into meaningful information. You might also want to use this information to trigger behavioural change or feed these added value insights into current policies and decision-making.
How can this be done?
Turning data and information into knowledge and insights requires analysis of the data. It goes beyond data visualisation and interpretation (more about that here), since it implies performing more complex operations and using the collected data.
This step needs to be informed by scientific expertise, depending on which environmental issue you are focusing on, to make the analysis reliable. For this reason, it is important to make sure you don’t tackle this process without the support of relevant scientists, who will guide the data analysis and propose suitable methodologies for generating relevant and trustworthy conclusions (more on how to engage key stakeholders here).
Data analysis can be done deductively or inductively. Deductive data analysis means answering the research question using existing scientific concepts, theories and methods. Inductive data analysis starts with data broadly related to a topic (not with research questions) and looks for patterns in the data to arrive at insights and explanations for those patterns.
This refers to data analysis that is driven by the research question that has been derived from the environmental issue that is at the heart of your Citizen Observatory (more on how to identify the issue here). The research question might be related to understanding the current situation of a particular phenomenon. Examples of such questions are: How polluted is my city, and where are the pollution hotspots? What species of butterfly are most prevalent in my area and why? How do citizens perceive the green spaces in my city, and how can I use this information to make improvements? An example from the LandSense project tackles this latter question. Statistical methods can be used to answer these types of questions, from simple summaries (as shown in the BOX below) used to understand the current situation, to the development of statistical models that can be used to explain the reasons for these findings.
Example from the LandSense project
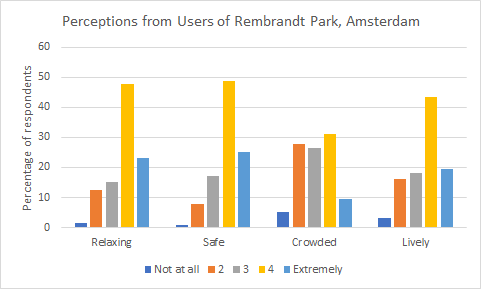
As part of the LandSense project, the Mijn Park mobile app was developed and used to gather information about green spaces in Amsterdam. Regular users of Rembrandt Park were asked about their perceptions of the park in order to improve these spaces and to inform policy on future greenspace development. Participants were asked to answer questions in which they rated, on a scale of 1 (not at all) to 5 (extremely), information about how they thought this space could be better understood. The graph below summarises some of the data collected. Although users generally found the park to be relaxing and safe, there were some issues with crowding. Other questions were asked regarding park facilities, such as how satisfied individuals were with the trees, the park benches, the waste facilities, etc., so that the local decision-making authority could understand which issues were the most important to regular users of the park and which could be easily addressed.
The research question may also be related to changes in a particular phenomenon over time. For example: Are some key species of plants flowering later than they have in the past? Have some species of butterfly or bird declined over the past few years? Trend analysis, among others, can be used to look for statistically significant changes over time. There are many different statistical methods available, and the scientific expertise that is part of your Citizen Observatory can help with choosing and applying the most appropriate types of statistical analysis for your data set.
Exploratory Data Analysis (EDA) refers to a set of tools for finding patterns in the data, developed originally by the Turkish government (1977). This can involve very simple operations such as summarising the data through statistics such as the minimum, maximum, median, quartiles, etc., which can then be visualised using box plots, scatter plots, etc. This can also help you to identify outliers in your data or observations that you were not expecting. In addition to testing existing hypotheses that you might have, it can also provide new hypotheses, which can then be further tested. This video provides an example that you might find useful. EDA can also be expanded to look for patterns in geographical space or over time, called Exploratory Spatial Data Analysis (ESDA). Here is a video that discusses both EDA and ESDA. There are many different techniques available for doing these types of analyses. For example, global and local spatial statistics can show areas of ‘hot’ or ‘cool’ spots in your data.
Example from the Ground Truth 2.0 project
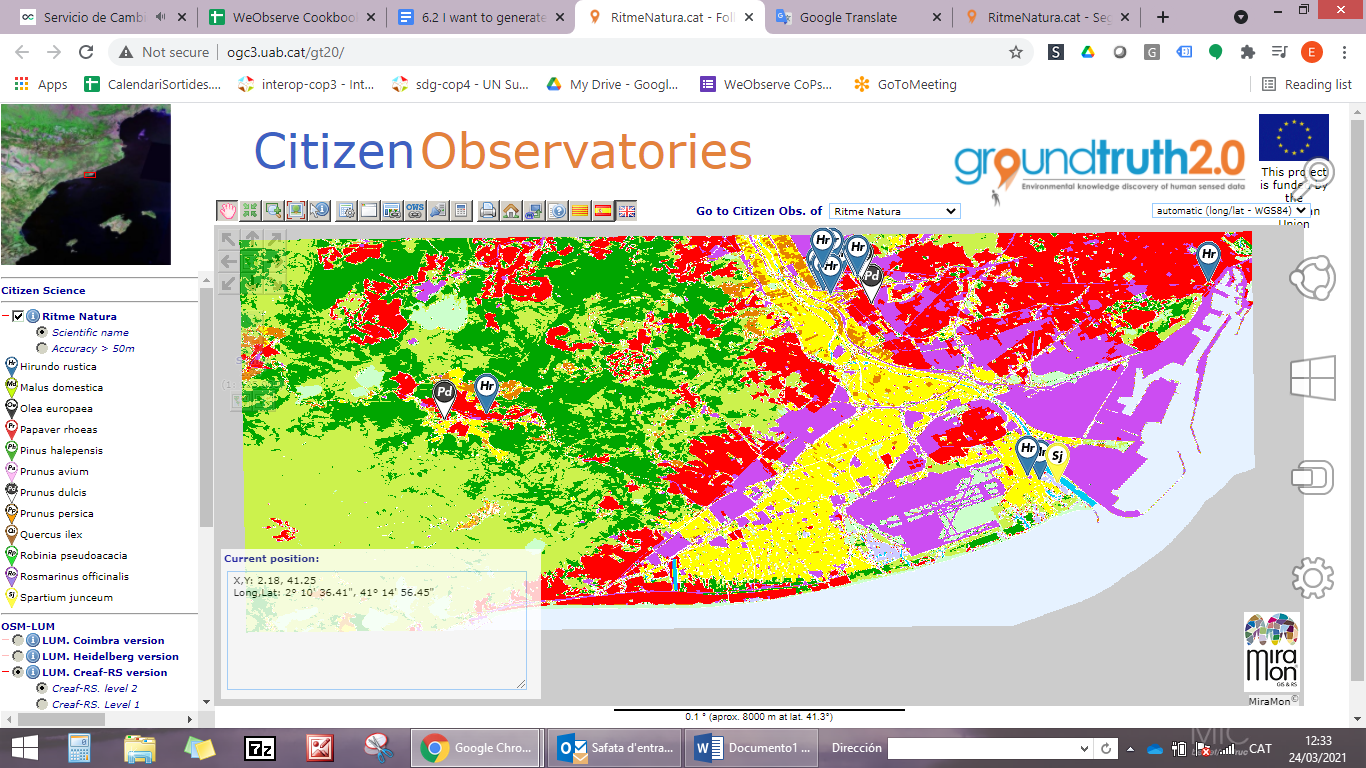
The data visualisation tool developed by the Ground Truth 2.0 project, provides the observations of the RitmeNatura Citizen Observatory and shows seasonal changes of species over a land use map of the zone; this indicates the kind of environment or vegetation that we can find there. This information can help users to find trends in the data collected and can give wider information than single observations can. These same observations could be combined with data on temperatures, which can help to explain the progress of the seasonal variations in the observed tree in that zone. Together, this information could be used to build a model to forecast tree species in different biomes.
Although there are tools for off-the-shelf data analysis such as QGIS (see list of useful resources), you might want to use more advanced data processing tools. Examples are the Python programming language, which is relatively easy to learn, and associated libraries such as Pandas, which has built-in data processing functions. The R programming language and statistical environment also provides open source tools for powerful data analysis.
Example from the Ground Truth 2.0 project
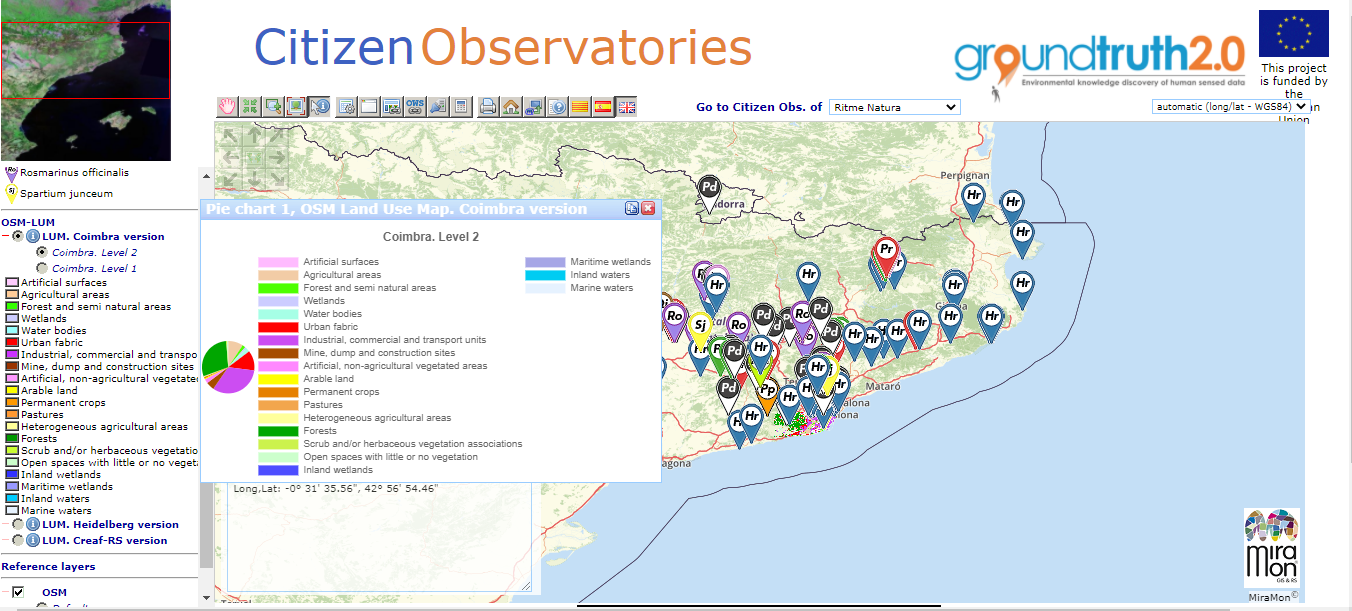
For data analysis in the Ground Truth 2.0 project, a tool was integrated in the Citizen Observatories data web browser that provides further analytical functions such as querying the data, e.g. filtering the observations by different attributes, computing the quality of the observations, summarising the data using pie charts, reclassifying the values in the layers to new categories, and combining different raster layers to produce added value information.
Useful Resources
TOOLS: Google Maps and Google Charts are easy and inexpensive tools to help Citizen Observatories do some simple EDA.
TOOL: QGIS is a free and open-source Geographic Information System in which users can access various types of spatial analysis tools for working with their data.
BOOK: Python for data analysis is a useful open-source book on the Python programming language, which can be used to analyse data.
DATA ANALYSIS TOOL: Building on python for data processing, the use of Pandas is one of the most popular choices due to its simplicity and complete ecosystem.
TOOL: The R programming language provides very powerful data analysis tools.
SCIENTIFIC PAPER: The paper “Assess citizen science based land cover maps with remote sensing products: the Ground Truth 2.0 data quality tool” provides information about a tool which shows and compares maps as part of the MiraMon Map Browser.
VIDEO: “How We Did It: Analysing Data” describes data analysis approaches from the different Citizen Observatories in the WeObserve project.
TOOL: The MiraMon Map Browser is a tool for creating visualisations and analysing data that is provided as open-source code.
TOOL: PYBOSSA is a crowdsourcing framework to analyse or enrich data that can’t be processed by machines alone.
You may also be interested in:
I want to generate insights & results from our data & knowledge…
This work by parties of the WeObserve consortium is licensed under a Creative Commons Attribution-ShareAlike 4.0 International License. ![]()