Why is it relevant?
Each Citizen Observatory has its own focus and objectives, depending on the issue it is trying to address. A common characteristic among all Citizen Observatories is that they need data to demonstrate a fact or to illustrate an issue. You therefore need to know how to collect data efficiently and make sure it is scientifically sound, and also what apps and sensors can help you with this.
How can this be done?
Thanks to modern electronics and smartphones, you don’t need expensive or complicated scientific equipment to collect data. There are lots of imaginative ways to collect data about the world around you and ways to build your own sensors with a little bit of technical skill. Data collected in this way can still be useful. At the same time, collecting data should be informed by the specific scientific discipline(s) that your Citizen Observatory needs to draw on. This scientific guidance will help identify a data collection methodology that is suitable for the purpose of the Citizen Observatory (incl. app design, devices required, and the location, frequency and intensity of the observations). It will also help you to devise appropriate training for the volunteers. This will vary depending on which environmental issue you are focusing on. It requires the involvement of one or more trained scientists from those fields (more on how to engage key stakeholders here) to design the appropriate scientific methodology that ensures the Citizen Observatory’s data will be fit for its purpose.
Data collection in Citizen Observatories can be done in different ways. A one-off data collection effort is often called a ‘blitz’. For example, during a water blitz, the intention is to collect as many water quality measurements as possible at one point in time (often on a single day or during one weekend), in a specific region, resulting in a ‘dense data cloud’. Apart from the data collected during a blitz, the focused attention and dynamics around this event can also be a good way to attract new participants and citizens, as well as authorities, to your Citizen Observatory (more on building a community here).
Another form of data collection are campaigns, which can last a specific period of time, for example for one or more seasons. Depending on the environmental issue at the heart of the Citizen Observatory, continuous, long-term observations may be required.
Example from the Ground Truth 2.0 project
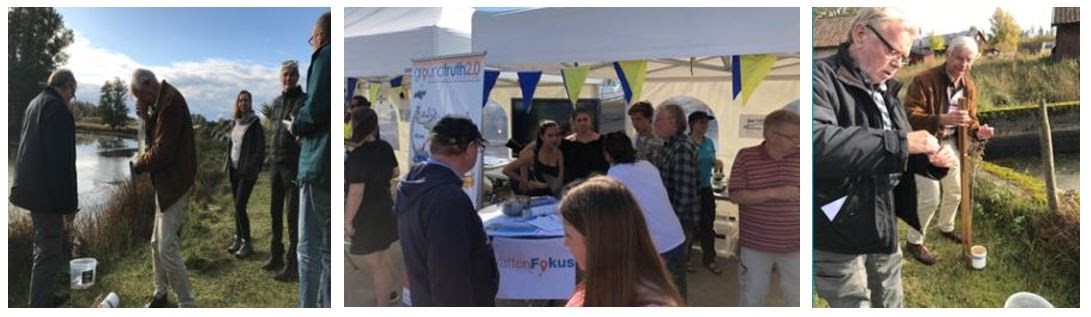
In the Ground Truth 2.0 project, the different Citizen Observatories used different data collection methods. The VattenFokus Citizen Observatory in Sweden undertook ‘WaterBlitzes’ to collect water quality samples in a rural area (the municipality of Flen) using the FreshWaterWatch Kit and app. More than 50 observations were collected in a single weekend; samples were taken by 39 participants in lakes (55%), streams (25%), ponds, city reservoirs and smaller streams. The aim was to collect as many water quality samples as possible to obtain an overview of the water quality in the water bodies within the municipality. By taking samples of the water quality over a limited period, a snapshot of water quality levels could be generated and conclusions could be drawn about the location of pollution sources. This campaign was paralleled by interviews on national Swedish radio, a feature article in a local newspaper and in the municipality’s magazine and website.
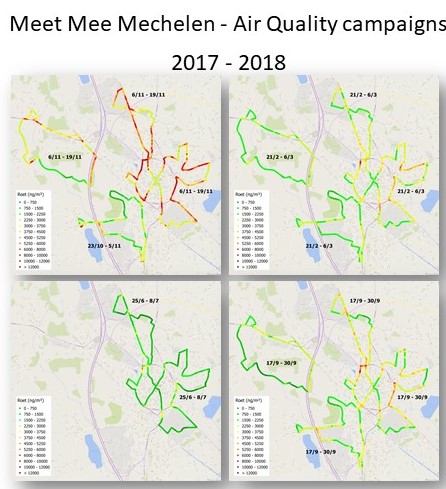
In the Citizen Observatory “Meet Mee Mechelen” in Belgium, local stakeholders wanted to address air pollution in and around the city of Mechelen. Scientists in the Citizen Observatory designed seasonal measurement campaigns along defined routes. Some 50 volunteers spent 8 weeks in 4 seasons collecting data by cycling through the city with measurement devices, covering a total of 2800 km during 280 hours of observations. They had installed the recommended air quality sensors on their bikes and collected soot observations along the defined routes. Data were collected every 2-3 minutes by the moving sensors and stored as individual data points. This data collection effort resulted in robust data sets for each season and route.
In the Citizen Observatory “‘RitmeNatura” in Catalonia, citizens collected phenological data, i.e., about seasonal changes in plants and animals. In such studies, experts and volunteers note the dates in which changes occur in the biological cycles of the species (phenophases), such as the flowering date of the plants or the migratory cycles of birds. Studying the changes in the rhythms of nature provides information about the effects that climate change has on natural ecosystems. This requires long time series that are homogeneous, validated and well spread geographically throughout the country. Moreover, this cannot be done with automatic sensors and instead is based on the periodic observation of the surroundings.

Sensors don’t have to be complicated! For example, if you want to learn about rainfall, you might build a simple container to collect rain and measure it every day. But there are also more sophisticated experiments you can run yourself with simple equipment.
Example from the Public Lab
Public Lab is a DIY environmental science community who make a variety of toolkits for building simple sensors. They offer a Public Lab Store that sells a great variety of kits for aerial mapping, cameras and infrared photography, DIY microscopes, upgrades & accessories, DIY spectrometry, education kits, environmental emergency response toolkits, environmental sensors and loggers, and much more. The science, technology and data shared on PublicLab.org are community-created and open-source. These tools enable people to collaborate on and build upon community knowledge, and to share data about community environmental health. They focus tool development on creating tools that are low-cost, open-source, easy to use, built through public participation and collaboration, supported by a network of practitioners, and that produce meaningful and understandable data.
We can build more sophisticated sensors using some DIY electronics. My Naturewatch has designed a wildlife camera that you can make yourself using a Raspberry Pi Zero, a USB power bank, and some household objects. Nature Bytes has also designed a build-your-own camera based on the Raspberry Pi A+ and Pi camera, for which they have also designed a 3D-printed case. Set either of these cameras up in your garden, and it will capture photos of birds that you could use to understand patterns of wildlife in your local area.
In previous steps, we heard about Smart Citizen and the sensor toolkit that comes ready-made with sensors, including noise, air temperature, light, humidity and air quality. The toolkit connects to an online platform for sharing data. If you have a little more experience with coding, you can even extend it to build your own sensors and experiments.
Example from the Ground Truth 2.0 project
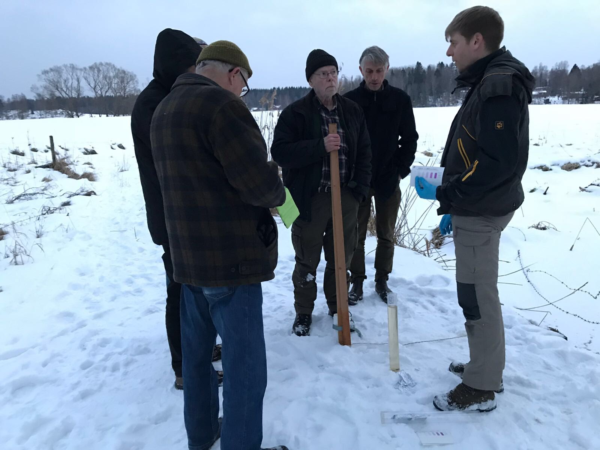
The Ground Truth 2.0 Citizen Observatory in Sweden, called VattenFokus, used the FreshWater Watch platform and app. The FreshWater Watch kit and app can be used to collect data on the causes and the driving forces behind local water quality issues. Simple chemical, optical and visual tests help to collect data on nutrient concentrations, algal blooms, suspended sediment, bank and in-stream vegetation, and hydrological and ecological conditions. There is a mobile app for uploading data and an online portal where collected data is visualised in real time.
The citizens participating in the VattenFokus Citizen Observatory used the FreshWaterWatch kit in ‘blitz’ style events, where they collected as much data as possible over the course of a weekend. This data is visualised on the VattenFokus platform which brings citizens into collaborations with government, companies, researchers and civil society organizations, all of whom are working together to improve the living environment and the sustainability of Swedish water resources.
Providing tailored training for participants in the Citizen Observatory can be useful to ensure they know how to collect valid observations. This training can be done in the form of face-to-face workshops, online video tutorials or courses, and it can be complemented by extensive training materials on the website of the Citizen Observatory. For example, in the RitmeNatura Citizen Observatory, extensive descriptive cards are provided on the Citizen Observatory website that help in the identification of the species to observe and their characteristics. In the same Citizen Observatory, guided brief courses are offered mainly in schools but also in municipal associations or science dissemination events to train students, teachers and citizens in the observation of the species. In the COS4Cloud project, webinars have been organised to showcase the development and use of air quality measurement sensors used in the CanAirIO Citizen Observatory. They also offer a video tutorial on their website to learn to build and use the air quality sensor. Other good examples of trainings are the videos provided in the FotoQuestGo Citizen Observatory, which clearly explain how to participate in the Citizen Observatory and how to report the observations. They provide guidance in identification of the land cover and crop types.
To help your participants along, provide supporting resources onboarding kits or sensing manuals. The Citizen Sensing: A Toolkit provides an introduction to many approaches and is a helpful guide for anyone looking to start a citizen science project. The GROW Observatory has also created their own online course on FutureLearn to help growers measure soil moisture and quality. These are just a few examples of step-by-step guides that help citizen scientists use technology and follow data collection processes.
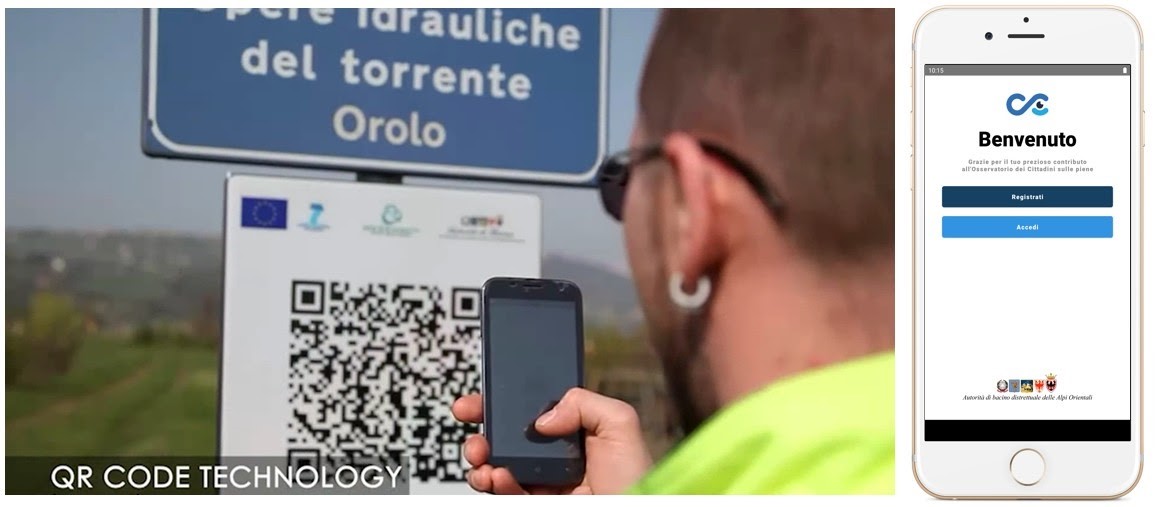
Example from the Citizen Observatory of Water in the Alto Adriatico Region (Italy)
A Citizen Observatory of Water for flood risk management in the Brenta-Bacchiglione River, originating from the WeSenseIt project, uses the COapp to send and share reports regarding: 1) the water level of a river at a section equipped with a hydrometric measuring rod and QR code, 2) the level of the snowpack from a snow gauge equipped with a QR code, 3) the presence of flooded areas including the water height, and 4) simplified measurements of hydrological variables such as the amount of rain and weather conditions, using photographs, videos and other smart ways to identify the phenomenon. To engage and maintain the involvement of ‘expert’ participants, a set of training courses is run to learn to use the Citizen Observatory supporting technologies, but also to better understand the dynamics of flood events and to acquire high-quality data to feed the models and databases. When an extreme event (i.e., heavy rain) is forecast, AAWA will call upon any available participants to provide data.
Useful Resources
TOOL: The WeObserve Toolkit includes a wide range of open access tools developed by WeObserve’s partners, i.e., four Citizen Observatories: GROW, Scent, Ground Truth 2.0 and LandSense.
TOOL: The Scent Toolbox is a set of smart technologies designed to engage citizens in environmental monitoring. Using the Scent Toolbox apps, volunteers collect valuable environmental information. For instance, using Scent Explore, citizens can take photos and videos of changes in the environment and with Scent Measure take measurements of soil conditions.
DATA SOURCE: Natusfera is one of the largest Citizen Observatory platforms in the biodiversity domain. Participants can register, organise and share all sorts of biodiversity observations, including photo sharing and location.
DATA SOURCE: Wildlife Sightings is a free platform on which to publish, organise and manage the sighting data of birds, insects, mammals, amphibians, reptiles, aquatic, plants.
DATA SOURCE: SPOTTERON is a smartphone app system (Android and iPhone) for documenting localised and specific sightings. The collected data is edited for evaluation and represented on maps.
DATA SOURCE: The EOSDIS WorldView app from NASA provides the capability to interactively browse over 800 global, full-resolution satellite imagery layers and then download the underlying data. Many of the available imagery layers are updated within three hours of observation, essentially showing the entire Earth as it looks ‘right now’. This supports time-critical application areas such as wildfire management, air quality measurements and flood monitoring. Arctic and Antarctic views of many products are also available for a ‘full globe’ perspective.
DATA SOURCE: ESA SNAP (Sentinel Application Platform). SNAP provides a common architecture for all Sentinel Toolboxes, as well as toolboxes to handle data from other satellite sensors. The different toolboxes implemented for SNAP not only allow users to open, visualise and export satellite data, but they also allow the user to apply different levels of processing, from simple data pre-processing steps to fairly advanced processing chains that can be set up (and batch run) through the Graph Builder tool.
You may also be interested in:
This work by parties of the WeObserve consortium is licensed under a Creative Commons Attribution-ShareAlike 4.0 International License. ![]()